How do you reduce sample size in clinical trials? Reducing sample size without losing power can be accomplished by one of three principles. This paper examines these methods and demonstrates 15 ways to reduce sample size in clinical trials.
15 Ways To Reduce Sample Size In Clinical Trials

(Updated November 2018)
15 Ways To Reduce Sample Size In Clinical Trials
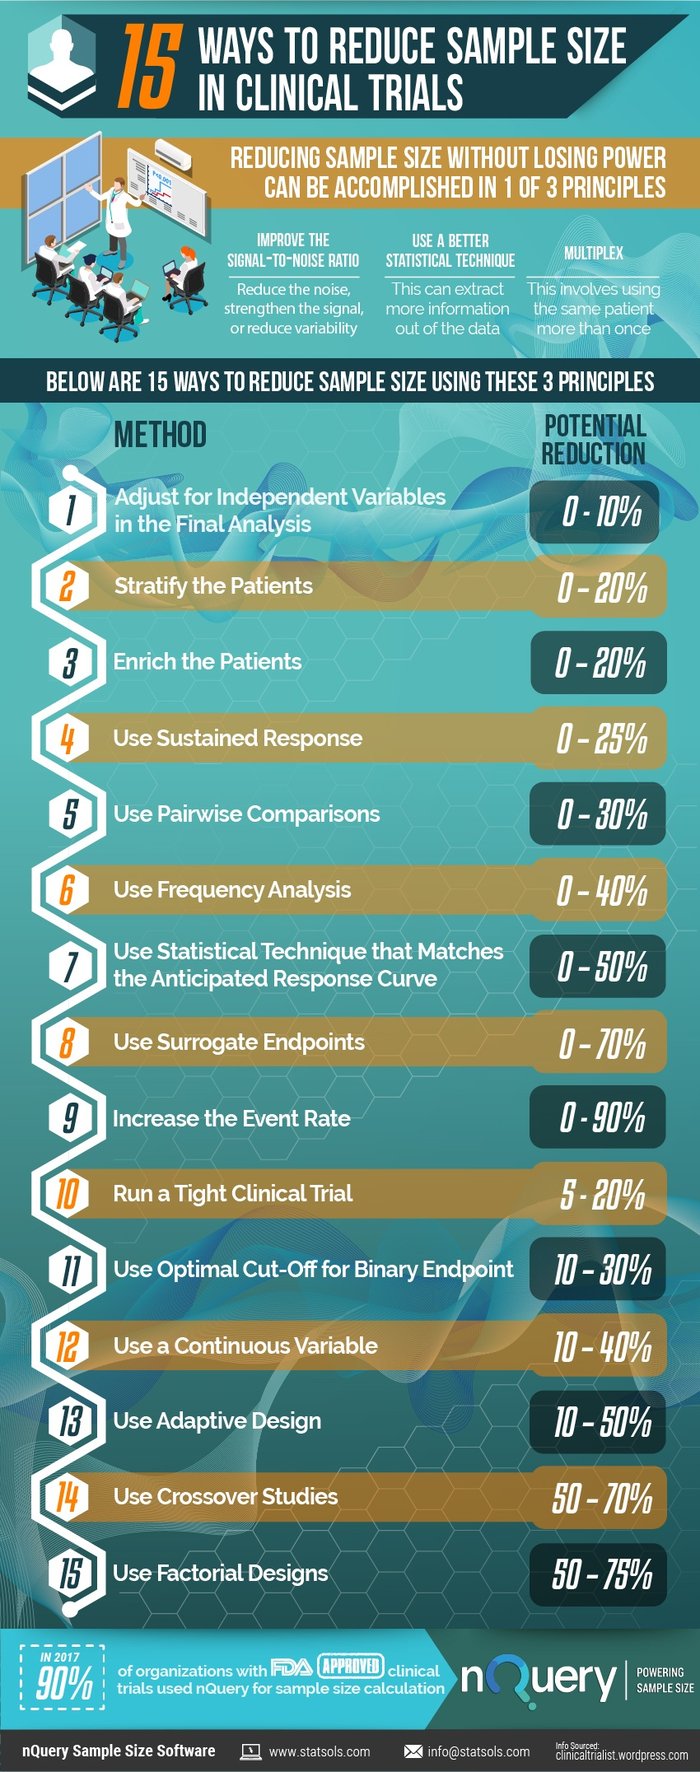
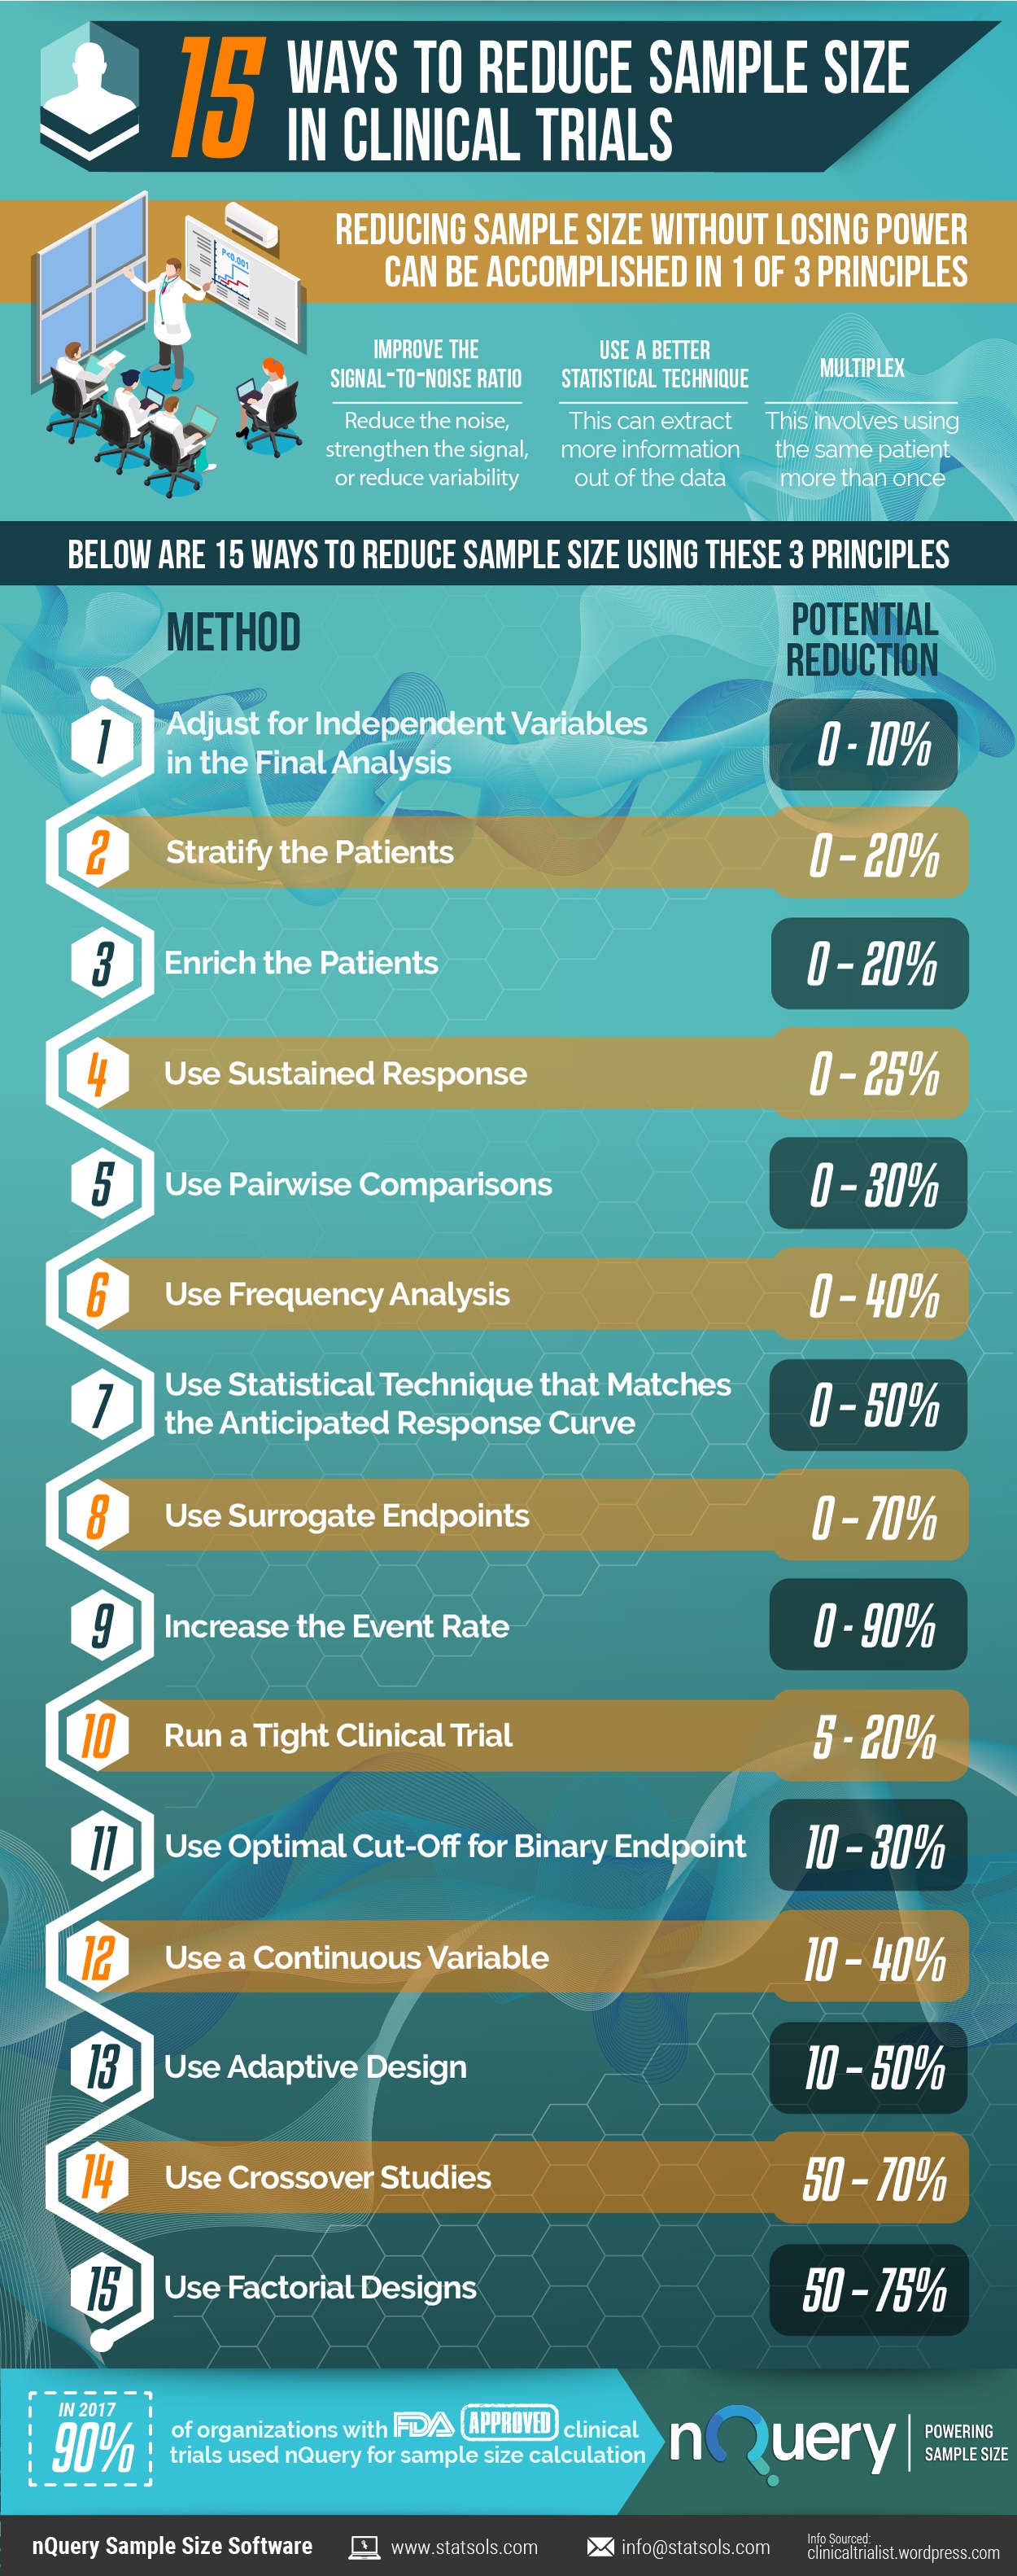
- Adjust for Independent Variables In the Final Analysis 0-10%
- Stratify the Patients 0-20%
- Enrich the Patients 0-20%
- Use Sustained Response 0-25%
- Use Pairwise Comparisons 0-30%
- Use Frequency Analysis 0-40%
- Use Statistical Technique that Matches the Anticipated Response Curve 0-50%
- Use Surrogate Endpoints 0-70%
- Increase the Event Rate 0-90%
- Run a Tight Clinical Trial 5-20%
- Use Optimal Cut-Off for Binary Endpoint 10-30%
- Use a Continuous Variable 10-40%
- Use Adaptive Design 10-50%
- Use Crossover Studies 50-70%
- Use Factorial Designs 50-75%
To view the complete detailed list of 1#-15, click below

Why reduce sample size in clinical trials?
Clinical trial costs have surged over the past decade, with a report from Medrio stating that from 2008 to 2013, the average cost per patient increased by up to 157%. A major contributor to the cost of a clinical trial is subject recruitment and the associated staff costs. So examining every opportunity to reduce the sample size for a study is an important and necessary step in drug development.
What are the risks of reducing sample size in clinical trials?
A study that has a sample size which is too small may produce inconclusive results and could also be considered unethical, because exposing human subjects or lab animals to the possible risks associated with research is only justifiable if there is a realistic chance that the study will yield useful information.
Similarly, a study that has a sample size which is too large will waste scarce resources and could expose more participants than necessary to any related risk. Thus an appropriate determination of the sample size used in a study is a crucial step in the design of a study.
Clinical trial design for smaller sample size
Investigators strive to deliver the most efficient clinical trial as possible. A trial can be designed with a small sample size in mind such as when dealing with a rare disease as the qualifying population is usually low, so there is an opportunity to plan the statistical analysis to account for the expected small numbers of patients to maximize the information produced from the trial. However most studies plan on larger sample sizes and as such need to to take the necessary steps to reduce the risk and costs in their clinical trials.
nQuery sample size software is a sample size calculator that helps researchers with the difficult task of sample size calculation, so they can accurately and confidently calculate the appropriate sample size for their study. Below is a list of 15 Ways To Reduce Sample Size In Clinical Trials that Biostatisticians can consider for their clinical trial designs.
How to reduce sample size without losing power in clinical trials?
Reducing sample size without losing power can be accomplished by one of three principles.
- Improve the signal-to-noise ratio. To do this, you can either reduce the noise, strengthen the signal, or reduce variability (which will both reduce the noise and strengthen the signal).
- Use a better statistical technique. By doing this you may be able to extract more information out of your data.
- Multiplex. On a basic level this involves using the same patient more than once.
Read the infographic below '15 Ways To Reduce Sample Size In Clinical Trials' to learn more.
15 Ways To Reduce Sample Size In Clinical Trials
Let us further examine the 15 ways
to reduce sample size in clinical trials
- Adjust for Independent Variables In the Final Analysis 0-10%
- Stratify the Patients 0-20%
- Enrich the Patients 0-20%
- Use Sustained Response 0-25%
- Use Pairwise Comparisons 0-30%
- Use Frequency Analysis 0-40%
- Use Statistical Technique that Matches the Anticipated Response Curve 0-50%
- Use Surrogate Endpoints 0-70%
- Increase the Event Rate 0-90%
- Run a Tight Clinical Trial 5-20%
- Use Optimal Cut-Off for Binary Endpoint 10-30%
- Use a Continuous Variable 10-40%
- Use Adaptive Design 10-50%
- Use Crossover Studies 50-70%
- Use Factorial Designs 50-75%
1. Adjust for Independent Variables in the Final Analysis
An alternative to stratification is prespecified adjustment of the final analysis for imbalances. For example, you can prespecify in an MI trial that if one group has more anterior MIs than the other that adjustment to account for the imbalance will be made (the mortality rate for the group with more anterior MI will be adjusted downward for example).
This can reduce variability and sample size. This technique has all the typical shortcoming associated with multivariate analysis and I am not a proponent of it.
Potential reduction in sample size:
0 – 10%
2. Stratify the Patients
Similar to the above strategy, you can stratify the patients. This insures you minimize any potential baseline imbalance, and you can adjust your analysis to maximize the power of the study. Stratification is particularly helpful if the patient population is heterogeneous and the heterogeneity may impact the outcome significantly.
Potential reduction in sample size:
0 – 20%
3. Enrich the Patients
You can enrich the patient population in ways that will reduce the sample size in a substantial way.
The first way is to make the patient population homogeneous. By making the patient population as similar to each other as possible, you will reduce the variability. For example, rather than including all patients with MIs, if you only include patients with anterior MIs, you are likely to have lower variability in outcomes. The tradeoff is that the generalizability of the study suffers.
Alternatively, a compromise between power and generalizability would be to enroll all comers, but prespecify the primary endpoint as the enriched subgroup, and use either a secondary or hierarchical primary endpoint for the all-comers group.
The second is to select the patient population that is most likely to show a response or is more likely to show a greater amount of response. For example, if you were performing a pain study, patients with an average pain score of 5 might be more likely to have 3 point decrease in pain than patients with an average pain score of 3. Or, patients who have had pain for a few weeks may be more likely to respond than patients with refractory pain who have had the symptoms for years.
The third is to select patients who are more likely to have more events. For example, patients with anterior MIs from the example above are more likely to die than patients with inferior MIs. If your endpoint is death, then you will have more power with anterior MI patients because there will be more events.
Potential reduction in sample size:
0 – 20%
4. Use Sustained Response
In some diseases, such as Crohn’s disease, the natural course of the disease is
highly variable and/or the measurement of outcome is inconsistent.
Many patients may have falsely positive responses briefly only to relapse. In that
case, sustained response can remove some of the noise.
A sustained response requires that the patient show improvement on multiple visits or over a certain minimal length of time.
Potential reduction in sample size:
0 – 25%
5. Use Pairwise Comparisons
If you can use the same patient multiple times, that will reduce the variability of the measurements and increase power.
For example, rather than using average baseline blood pressure vs. average post- treatment blood pressure, use average change in blood pressure for each person.
Potential reduction in sample size:
0 – 30%
6. Use Frequency Analysis
In some instances, a patient might have multiple events (such as seizures). If the events are independent, then you can use the number of events rather than the number of patients who have an event as the endpoint. This will reduce the sample size.
Potential reduction in sample size:
0 – 40%
7. Use Statistical Technique that Matches the Anticipated Response Curve
Standard statistical techniques assume a standard response curve. If you anticipate
that there will be a subgroup that will respond particularly well, or if you anticipate
that the response over time will not be a smooth curve, or if you believe that there
will be other non-standard distribution of response, then your statistician should be
able to use a more suitable statistical technique and improve the power.
For example, if you anticipate that your drug will have negative effects short term but positive effect long term, your statistician might introduce a time varying covariate to your Cox proportional hazard model. That will compensate for the fact that your drug has different effect over time and give you more power
If you anticipate that the median survival with your drug will be about the same but
that the tail end of your survival curves will be different (in other words, there will be
a 10% of the patients who will live for years but 90% will derive no benefit) then you
might want to use a 2-year survival rate landmark analysis rather than time-to-death survival analysis
Potential reduction in sample size:
0 – 50%
8. Use Surrogate Endpoints
Surrogates are measurements (such as glucose levels or bone mineral density) that
are correlated with the disease outcome (cardiovascular events, renal failure, or hip
fractures) and hopefully with treatment effect.
They are commonly used because they are easier to measure, have less variability,
and/or occur faster than the ultimate clinical outcome.
There are a lot of subtleties and pitfalls in using surrogate endpoints, but in general,
if you can pick one that is in the causal pathway of the disease, surrogates can help
reduce the sample size significantly.
Potential reduction in sample size:
0 – 70%
9. Increase the Event Rate
Studies with very low event rates can require very large sample sizes. For example, a
cardiovascular trial with mortality rates of 6% in the active arm vs. 7% in the control
arm would require tens of thousands of patients.
You can sometimes reduce the sample size by increasing the event rate. There are
several ways to increase the event rate, including changing the definition of the
event, increasing the follow-up period, using a surrogate endpoint (discussed below
and in another post), enriching the patient population (discussed below), or using a
composite endpoint.
A composite endpoint includes multiple endpoints in one. They tend to be the most
useful and clinically relevant for diseases that have multiple effects, such as
diabetes or lupus. An example of a composite endpoint would be an endpoint of
“death or MI.”
Composite endpoints can be tricky, because you may need to weight each
component separately and the endpoint can become complex. For example, you
might want to weight renal failure more than skin rash in a lupus composite
endpoint.
Many clinical statisticians are not trained in designing such endpoints (statistician
from the financial industry are actually often better trained for this) so you would be
well served by consulting someone with experience in designing and validating
composite endpoint.
Returning to the earlier example, if the event rate for the composite endpoint of
death/MI were 12% vs. 14% in the above cardiovascular trial, then the sample size
would decrease.
It’s important to keep in mind that in order for composite endpoint to result in
smaller sample size, the absolute difference between the two arms must increase as well.
For example, event rate of 12% vs. 13% would not result in a smaller study
compared to 6% vs. 7%. In fact, it would result in a larger study, as I explained in the
previous point made above.
Potential reduction in sample size:
Variable 0% – 90%+
Your Sample Size questions answered here
To view the complete detailed list of 1#-15, click below


Comments (6)