A key drawback of the traditional 3+3 design in dose escalation is its slow processing of data to reach the target dose. In contrast, the Continual Reassessment Method designs produce an expedited convergence to the target dose or the doses near target.
Dose Escalation:
Quickly determine the Maximum-Tolerated Dose through Continual Reassessment Method
The primary objective of a phase I clinical trial is to establish the maximum tolerated dose (MTD). Dose-finding trials are essential in drug development as they establish recommended doses for later-phase testing. This will then ultimately be used in the new drug application (NDA). We need reliable, efficient phase I trial designs for faster, cheaper drug development.
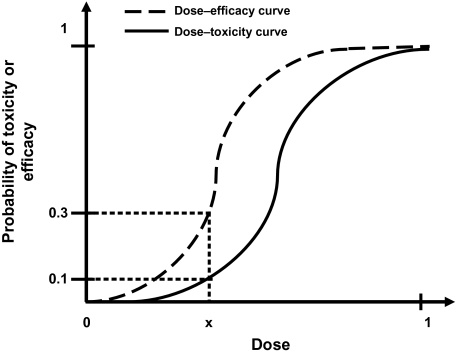
When creating the optimal dose, there is an onus on researchers to treat each patient ethically. By incorporating efficacy and toxicity into their assessment, they reach the targeted toxicity level (TTL) or the probability of toxicity. The TTL is then used to discover the maximum tolerated dose (MTD).
The emergence of the Continual Reassessment Method
A wide variety of dose finding approaches are available to researchers. These consist of algorithm or model-based designs.
Algorithm-based designs such as the 3+3 design (Carter, 1987), use rules fixed during trial design to select the MTD and allocate patients to a dose level. Dose levels are assigned using information from patients at one dose level.
Model-based designs such as continual reassessment (CRM) (O'Quigley), allocate patients to a dose level using a targeted toxicity rate and a statistical model describing the dose–toxicity relationship between the dose levels.
It is the opinion of many researchers that the CRM and model based designs would have a far larger uptake in Phase I clinical trials if an easy to use software application is available for CRM.
Cheung (2013) formulated and tested a specific method for sample size calculation for the CRM, which is now available in the latest version of nQuery.

Advantages of the (Bayesian) Continual Reassessment Method
A key drawback of the traditional 3+3 design in dose escalation is slow processing of data to reach the target dose. In contrast, CRM designs show an expedited convergence to the target dose or the doses near target.
- When the CRM was first introduced by O’Quigley it drew much attention from the biostatistical community. Its proponents believe it to be superior to traditional dose-escalation designs because it “learns” from information gained at earlier time points.
- Many variations have been published and reviewed.
- The advantage of this is particularly useful for quick progression through this stage of a clinical trial and to secure budget allocations.
However, the determination of the appropriate sample size remains a challenge.
CRM + Sample Size in nQuery
Some general rules for calculating sample size are provided for CRM but are ad hoc. As a result, both researchers and reviewers alike may tend to be wary of the CRM due to safety concerns. There is a definite need for support and guidance on sample size justification early in the planning stage. This is why we have implemented this feature into the latest release of nQuery.
There are several commonly used stopping rules for CRM designs:
- A fixed number of patients is decided at the onset of the trial and the CRM continues until the total sample size is reached, regardless of the number of doses considered and the number of patients treated per dose.
- Another method is to increase the sample size iteratively until a given probability of correct selection is reached.
The calculation implemented in nQuery is based on an empirical approximation for the CRM using the power dose-toxicity function, F(d, β) = dexp(β), where d is the dose and β has a normal prior with mean 0 and variance 1.34. The sample size is found using an iteration procedure, where the smallest sample size required to achieve Bn(DLT, ψ, nLevel) ≥ APCS, for some prespecified APCS, is selected. B is the benchmark index for the MTD estimator, and it is assumed that the first patient starts at the median dose level.
The table provides an initial lower bound for the sample size, and can be used as a benchmark for further efficiency calculations. It is calibrated for the most useful and common values for phase I trials, and gives the option of calculating the APCS for a given sample size.
In addition, the relationship between the various parameters in the model and the sample size or APCS can be examined. This particular method finds its use in facilitating a quick assessment of the sample size in a phase I trial, and gives an insight as to whether a phase I dose finding trial is sufficiently powered.
Below we see how effectively the Continual Reassessment Method
can be completed in nQuery
Further Reading:
http://biostats.bepress.com/cgi/viewcontent.cgi?article=1074&context=jhubiostat
https://www.ncbi.nlm.nih.gov/pmc/articles/PMC3843987/
https://www.nature.com/articles/bjc2017186
Interested in learning about Bayesian Assurance?
We recently hosted a webinar
Bayesian Assurance: Formalizing Sensitivity Analysis For Sample Size.
You can watch this webinar on demand by clicking the image below.

In this webinar you’ll learn about:
- Benefits of Sensitivity Analysis: What does the researcher gain by conducting a sensitivity analysis?
- Why isn't Sensitivity Analysis formalized: Why does sensitivity analysis still lack the type of formalized rules and grounding to make it a routine part of sample size determination in every field?
- How Bayesian Assurance works: Using Bayesian Assurance provides key contextual information on what is likely to happen over the total range possible values rather than the small number of fixed points used in a sensitivity analysis
- Elicitation & SHELF: How expert opinion is elicited and then how to integrate these opinions with each other plus prior data using the Sheffield Elicitation Framework (SHELF)
- Why use in both Frequentist or Bayesian analysis: How and why these methods can be used for studies which will use Frequentist or Bayesian methods in their final analysis