


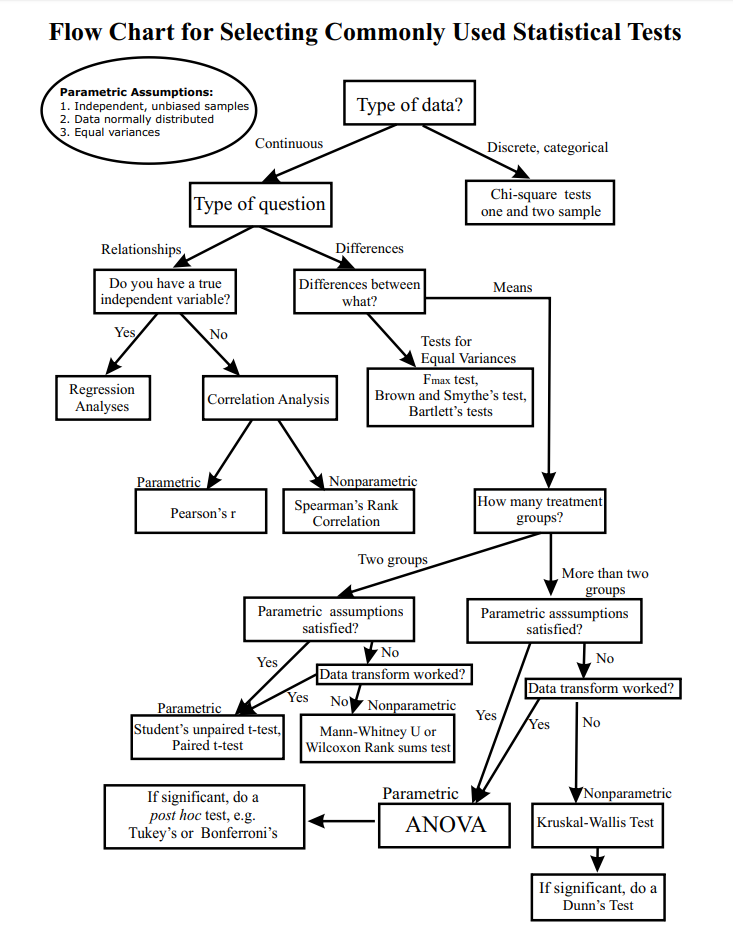
What type of statistical test to use?
Below is an extract from the Handbook of Biological Statistics by Prof John H. McDonald.
This can be used as a further guide to decide what statistical test to use in your research.
| Test | Nominal Variables | Measurement Variables | Ranked Variables | Purpose | Notes | Example |
|---|---|---|---|---|---|---|
| Exact test for goodness-of-fit | 1 | – | – | test fit of observed frequencies to expected frequencies | use for small sample sizes (less than 1000) | count the number of red, pink and white flowers in a genetic cross, test fit to expected 1:2:1 ratio, total sample <1000 |
| Chi-square test of goodness-of-fit | 1 | – | – | test fit of observed frequencies to expected frequencies | use for large sample sizes (greater than 1000) | count the number of red, pink and white flowers in a genetic cross, test fit to expected 1:2:1 ratio, total sample >1000 |
| G–test of goodness-of-fit | 1 | – | – | test fit of observed frequencies to expected frequencies | used for large sample sizes (greater than 1000) | count the number of red, pink and white flowers in a genetic cross, test fit to expected 1:2:1 ratio, total sample >1000 |
| Repeated G–tests of goodness-of-fit | 2 | – | – | test fit of observed frequencies to expected frequencies in multiple experiments | - | count the number of red, pink and white flowers in a genetic cross, test fit to expected 1:2:1 ratio, do multiple crosses |
| Test | Nominal Variables | Measurement Variables | Ranked Variables | Purpose | Notes | Example |
|---|---|---|---|---|---|---|
| Fisher's exact test | 2 | – | – | test hypothesis that proportions are the same in different groups | use for small sample sizes (less than 1000) | count the number of live and dead patients after treatment with drug or placebo, test the hypothesis that the proportion of live and dead is the same in the two treatments, total sample <1000 |
| Chi-square test of independence | 2 | – | – | test hypothesis that proportions are the same in different groups | use for large sample sizes (greater than 1000) | count the number of live and dead patients after treatment with drug or placebo, test the hypothesis that the proportion of live and dead is the same in the two treatments, total sample >1000 |
| G–test of independence | 2 | – | – | test hypothesis that proportions are the same in different groups | large sample sizes (greater than 1000) | count the number of live and dead patients after treatment with drug or placebo, test the hypothesis that the proportion of live and dead is the same in the two treatments, total sample >1000 |
| Cochran-Mantel-Haenszel test | 3 | – | – | test hypothesis that proportions are the same in repeated pairings of two groups | alternate hypothesis is a consistent direction of difference | count the number of live and dead patients after treatment with drug or placebo, test the hypothesis that the proportion of live and dead is the same in the two treatments, repeat this experiment at different hospitals |
| Test | Nominal Variables | Measurement Variables | Ranked Variables | Purpose | Notes | Example |
|---|---|---|---|---|---|---|
| Arithmetic mean | – | 1 | – | description of central tendency of data | - | - |
| Median | – | 1 | – | description of central tendency of data | more useful than mean for very skewed data | median height of trees in forest, if most trees are short seedlings and the mean would be skewed by a few very tall trees |
| Range | – | 1 | – | description of dispersion of data | used more in everyday life than in scientific statistics | - |
| Variance | – | 1 | – | description of dispersion of data | forms the basis of many statistical tests; in squared units, so not very understandable | - |
| Standard deviation | – | 1 | – | description of dispersion of data | in same units as original data, so more understandable than variance | - |
| Standard error of the mean | – | 1 | – | description of accuracy of an estimate of a mean | - | - |
| Confidence interval | – | 1 | – | description of accuracy of an estimate of a mean | - | - |
| Test | Nominal Variables | Measurement Variables | Ranked Variables | Purpose | Notes | Example |
|---|---|---|---|---|---|---|
| One-sample t–test | – | 1 | – | test the hypothesis that the mean value of the measurement variable equals a theoretical expectation | - | blindfold people, ask them to hold arm at 45° angle, see if mean angle is equal to 45° |
| Two-sample t–test | 1 | 1 | – | test the hypothesis that the mean values of the measurement variable are the same in two groups | just another name for one-way anova when there are only two groups | compare mean heavy metal content in mussels from Nova Scotia and New Jersey |
| One-way anova | 1 | 1 | – | test the hypothesis that the mean values of the measurement variable are the same in different groups | - | compare mean heavy metal content in mussels from Nova Scotia, Maine, Massachusetts, Connecticut, New York and New Jersey |
| Tukey-Kramer test | 1 | 1 | – | after a significant one-way anova, test for significant differences between all pairs of groups | - | compare mean heavy metal content in mussels from Nova Scotia vs. Maine, Nova Scotia vs. Massachusetts, Maine vs. Massachusetts, etc. |
| Bartlett's test | 1 | 1 | – | test the hypothesis that the standard deviation of a measurement variable is the same in different groups | usually used to see whether data fit one of the assumptions of an anova |
compare standard deviation of heavy metal content in mussels from Nova Scotia, Maine, Massachusetts, Connecticut, New York and New Jersey
|
| Test | Nominal Variables | Measurement Variables | Ranked Variables | Purpose | Notes | Example |
|---|---|---|---|---|---|---|
| Nested anova | 2+ | 1 | – | test hypothesis that the mean values of the measurement variable are the same in different groups, when each group is divided into subgroups | subgroups must be arbitrary (model II) | compare mean heavy metal content in mussels from Nova Scotia, Maine, Massachusetts, Connecticut, New York and New Jersey; several mussels from each location, with several metal measurements from each mussel |
| Two-way anova | 2 | 1 | – | test the hypothesis that different groups, classified two ways, have the same means of the measurement variable | - | compare cholesterol levels in blood of male vegetarians, female vegetarians, male carnivores, and female carnivores |
| Paired t–test | 2 | 1 | – | test the hypothesis that the means of the continuous variable are the same in paired data | just another name for two-way anova when one nominal variable represents pairs of observations | compare the cholesterol level in blood of people before vs. after switching to a vegetarian diet |
| Wilcoxon signed-rank test | 2 | 1 | – | test the hypothesis that the means of the measurement variable are the same in paired data | used when the differences of pairs are severely non-normal | compare the cholesterol level in blood of people before vs. after switching to a vegetarian diet, when differences are non-normal |
| Test | Nominal Variables | Measurement Variables | Ranked Variables | Purpose | Notes | Example |
|---|---|---|---|---|---|---|
| Linear regression | – | 2 | – | see whether variation in an independent variable causes some of the variation in a dependent variable; estimate the value of one unmeasured variable corresponding to a measured variable | - | measure chirping speed in crickets at different temperatures, test whether variation in temperature causes variation in chirping speed; or use the estimated relationship to estimate temperature from chirping speed when no thermometer is available |
| Correlation | – | 2 | – | see whether two variables covary | - | measure salt intake and fat intake in different people's diets, to see if people who eat a lot of fat also eat a lot of salt |
| Polynomial regression | – | 2 | – | test the hypothesis that an equation with X2, X3, etc. fits the Y variable significantly better than a linear regression | - | - |
| Analysis of covariance (ancova) | 1 | 2 | – | test the hypothesis that different groups have the same regression lines | first test the homogeneity of slopes; if they are not significantly different, test the homogeneity of the Y-intercepts | measure chirping speed vs. temperature in four species of crickets, see if there is significant variation among the species in the slope or Y-intercept of the relationships |
| Test | Nominal Variables | Measurement Variables | Ranked Variables | Purpose | Notes | Example |
|---|---|---|---|---|---|---|
| Multiple regression | – | 3+ | – | fit an equation relating several X variables to a single Y variable | - | measure air temperature, humidity, body mass, leg length, see how they relate to chirping speed in crickets |
| Simple logistic regression | 1 | 1 | – | fit an equation relating an independent measurement variable to the probability of a value of a dependent nominal variable | - | give different doses of a drug (the measurement variable), record who lives or dies in the next year (the nominal variable) |
| Multiple logistic regression | 1 | 2+ | – | fit an equation relating more than one independent measurement variable to the probability of a value of a dependent nominal variable | - | record height, weight, blood pressure, age of multiple people, see who lives or dies in the next year |
| Test | Nominal Variables | Measurement Variables | Ranked Variables | Purpose | Notes | Example |
|---|---|---|---|---|---|---|
| Sign test | 2 | – | 1 | test randomness of direction of difference in paired data | - | compare the cholesterol level in blood of people before vs. after switching to a vegetarian diet, only record whether it is higher or lower after the switch |
| Kruskal–Wallis test | 1 | – | 1 | test the hypothesis that rankings are the same in different groups | often used as a non-parametric alternative to one-way anova | 40 ears of corn (8 from each of 5 varieties) are ranked for tastiness, and the mean rank is compared among varieties |
| Spearman rank correlation | – | – | 2 | see whether the ranks of two variables covary | often used as a non-parametric alternative to regression or correlation | 40 ears of corn are ranked for tastiness and prettiness, see whether prettier corn is also tastier |
References
Chapter 37+45 of the second edition of Intuitive Biostatistics Harvey Motulsky.
McDonald, J.H. 2014. Handbook of Biological Statistics (3rd ed.). Sparky House Publishing, Baltimore, Maryland.
Campbell MJ, Machin D. In: Medical Statistics: A Common-sense Approach , 2nd edn. Chichester: Wiley, 1993:2.
Stats Flow Chart


