Accurately predicting your trial milestones when Survival or Time to event endpoints are being used can be very challenging. Predicting the number of events that will occur at various points in the trial depends is dependant on not just predicting the enrolment, but also predicting many other factors.
In this hypothetical example, we will provide a step by step guide of how you can achieve this using the predictive module in nQuery. The predictive model is used for accurately forecasting key clinical trial milestones.
Play the video below for a quick overview what the prediction
module in nQuery can do for your research.
Video not showing? Click here to accept marketing cookies
| Background - Milestones for Prediction |
|
We are conducting an interim analysis at 50% of the total required events of 374, i.e. we assume 187 events have occurred. We will also assume the total sample size which will be recruited to the study to be 460, and we will assume that enrolment is 87% complete at this point, i.e. 402 subjects have been recruited to the study. In addition, we will assume that 118 out of a total of 127 sites have been opened at this interim stage.
What will the expected length of time be until the required number of events are reached? How long until the total sample size of 460 is recruited? How many dropouts can be expected?
|
Summary of Necessary Parameter Estimates for Prediction:
| Parameter |
Value |
| Current Calendar Time (months) |
24.92 |
| Current Sample Size |
402 |
| Current Events |
187 |
| Current Dropout |
3 |
| Target Sample Size |
460 |
| Target Events |
374 |
| Sites Open |
118 |
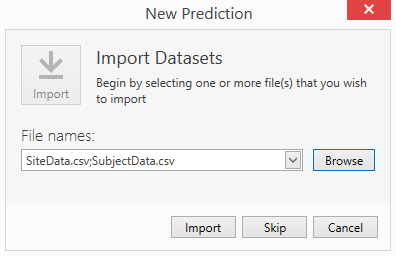
You will need the data sets for this example.
Please download them here:
SiteData.csv & SubjectData.csv.
Step 1:
Select the Create Prediction button from the Home window or alternatively use the New Prediction Button from the list of options available at the top of the window. Both options are highlighted below.

Step 2:
Use the Browse option from the new prediction window to select the relevant subject and site-level datasets that have been saved to your device and use the import button to import these into the software for use with the prediction.
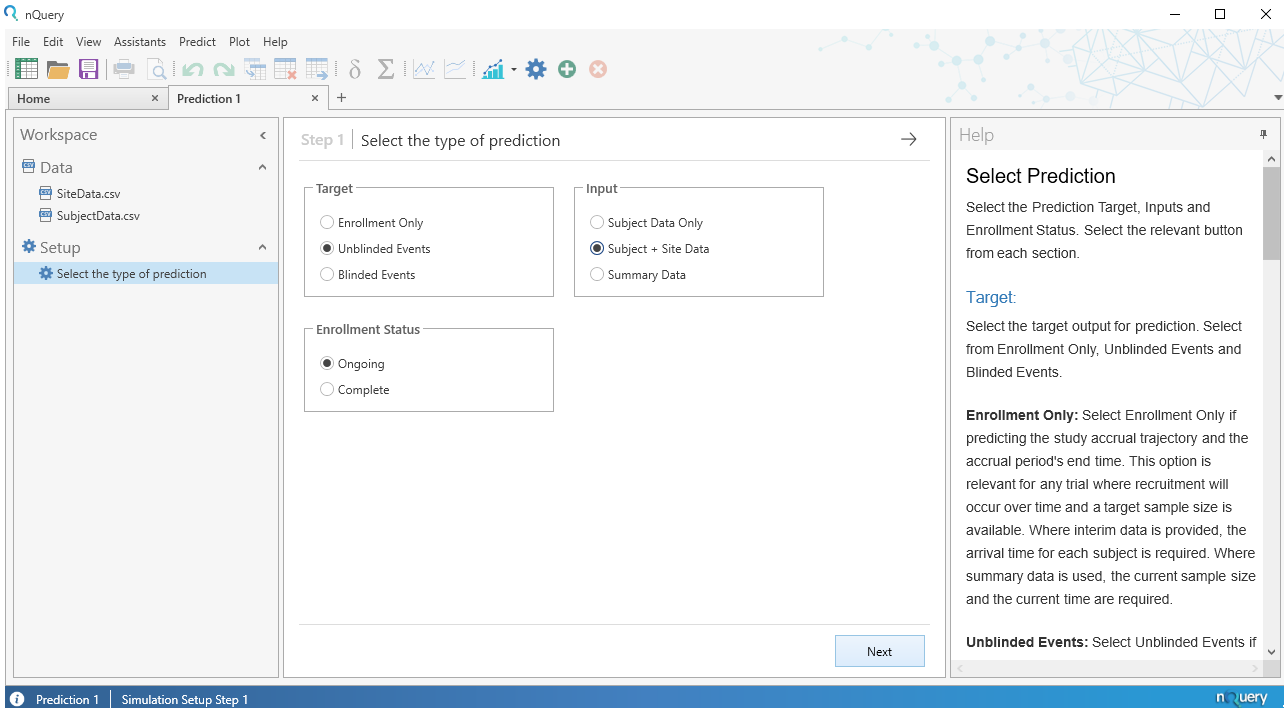
Step 3:
Once the datasets are imported proceed to specify the type of prediction we will be conducting. We want to use unblinded events as our Target, using subject and site data as our Input, and assuming an ongoing Enrolment Status, as is shown below. Once these are chosen we can click on ‘Next to proceed to the next step.
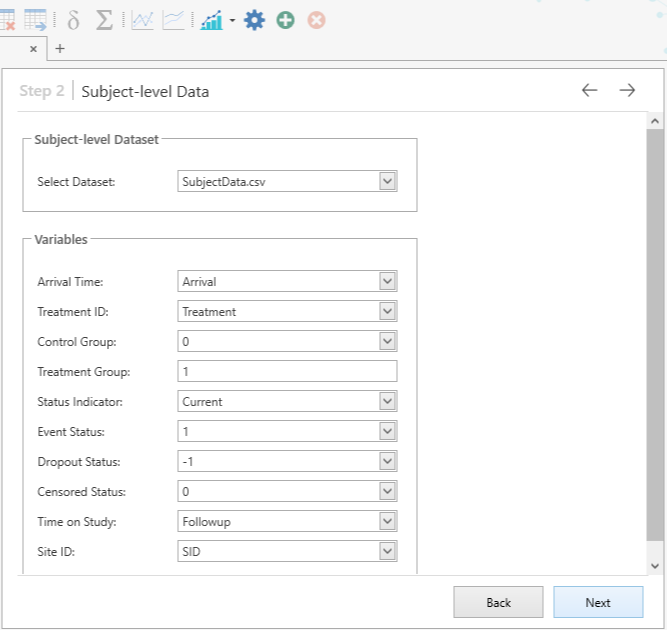
Step 4:
This brings us to the Subject level data step where we assign parameters to the subject data from the imported ‘SubjectData’ dataset. Proceed to specify the parameters as shown below. Once this is done click ‘Next’ once again.
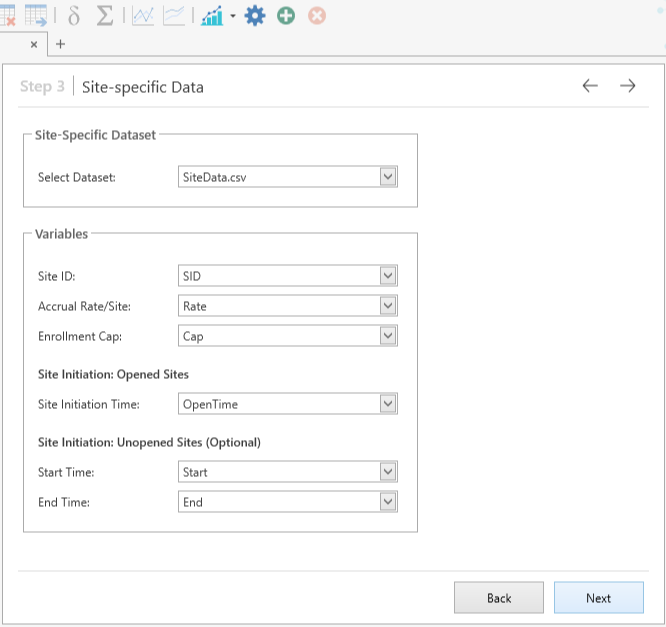
Step 5:
We are then brought to the site-specific data step where we assign parameters to the site data from the imported ‘SiteData’ dataset. Once the SiteData.csv file is chosen then the parameters here should be chosen correctly by default by the Software. Click ‘Next’ once again.
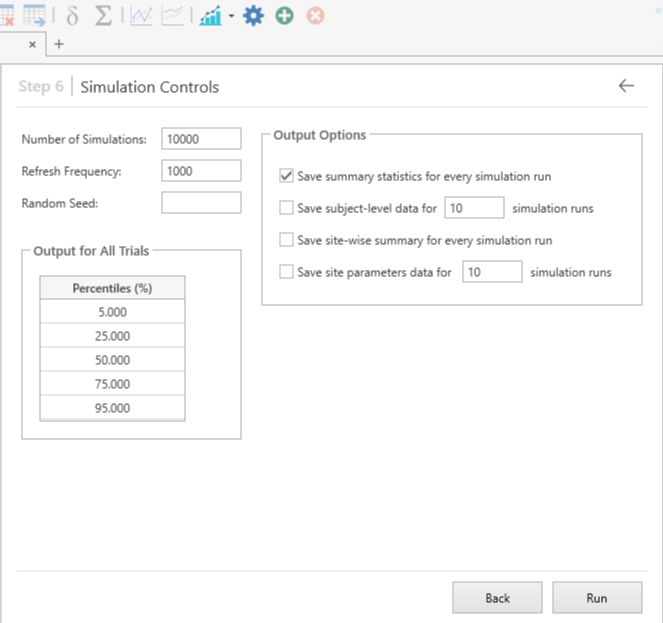
Step 6:
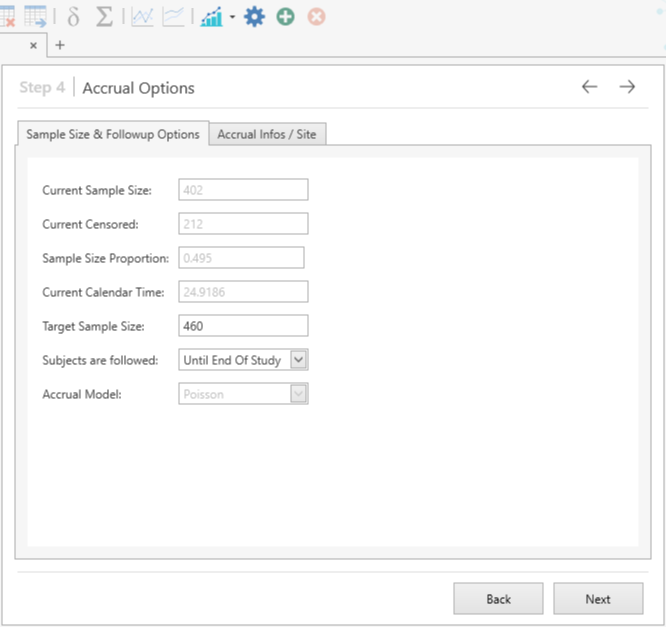
Next we are presented with the different parameters relating to the accrual. Most of these are set by default based on the datasets imported however for our example we will change the Target Sample Size from it’s default of 804 to our total sample size of 460 for this example, as shown below.
Step 7:
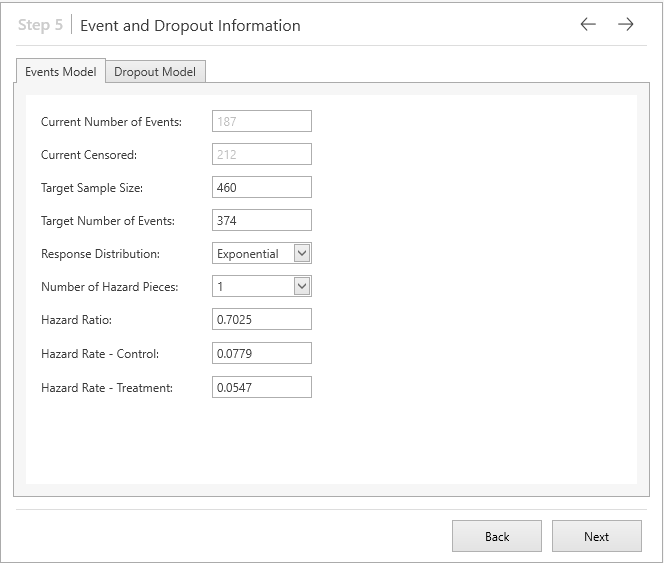
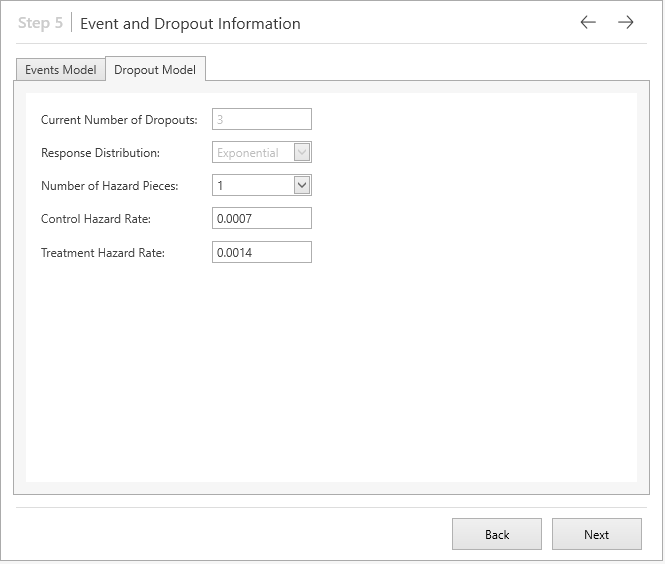
This brings us to the Event and Dropout information step in which all the default parameters values are correct and so we can click ‘Next’ to proceed to the final step.
Step 8:
Finally, we are brought to the simulation controls step where we can set values for both the simulation itself and also the output options for our prediction. For this example, we will leave these as their default values and click ‘Run’.
Results:
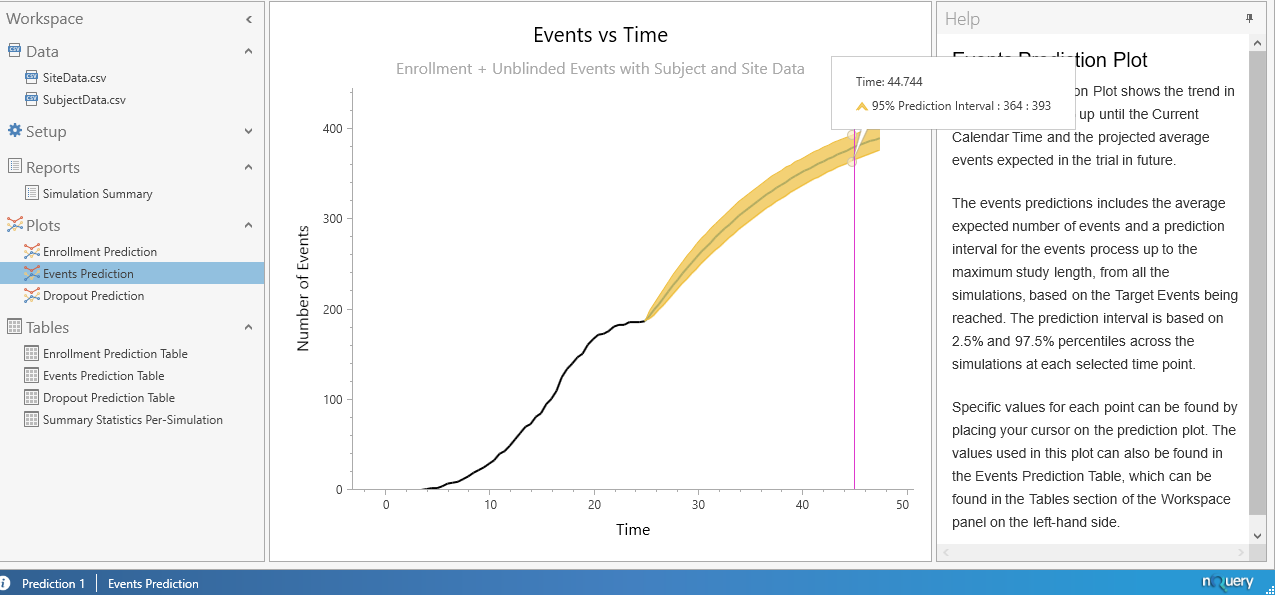
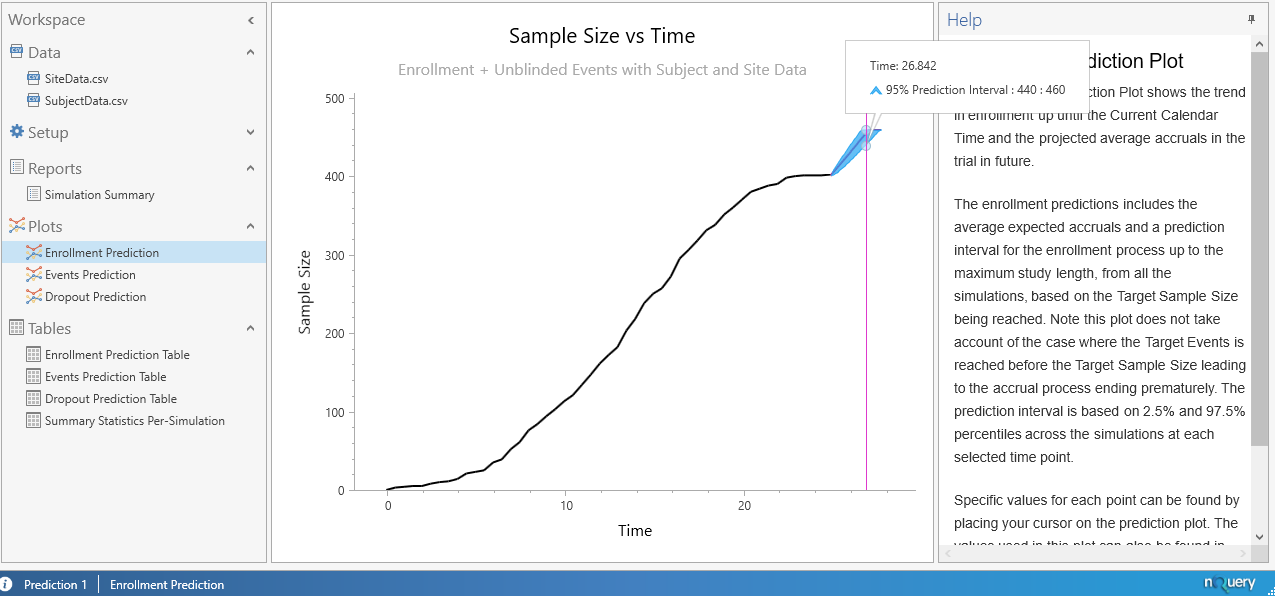
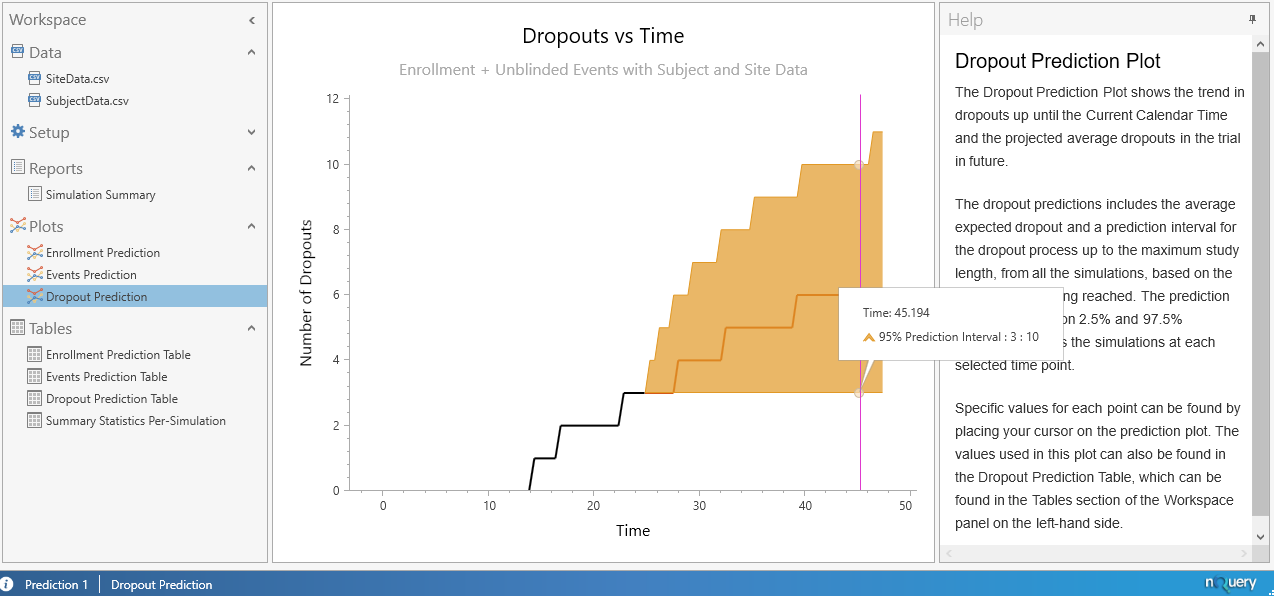
When completed, the results will appear with plots being produced for the enrolment prediction, events prediction and the dropout Prediction as can be seen below.
In addition, we are presented with multiple tables which contain the average and median values for the Enrollment, Events, and Dropouts prediction along with a 95% prediction interval for these parameters. In addition, a table containing the summary statistics for each simulation is also produced.
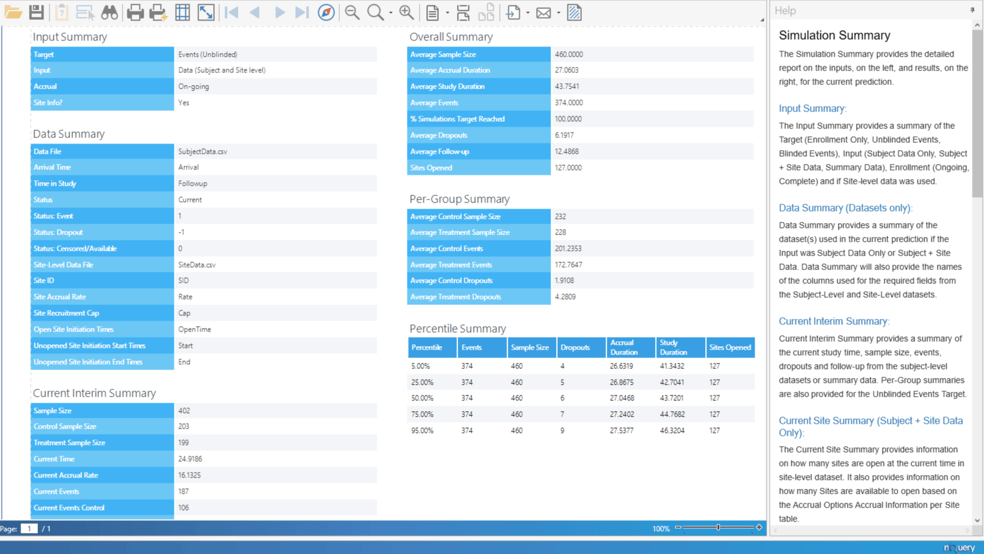
In our example we will focus on the Simulation summary report which is partially shown below. Within this report we can see that the average sample size from the simulations was 460, which indicates all simulated trials reached the total sample size of 460 as otherwise a value less than 460 would be produced. In addition we see the average time to reach these 460 subjects was 27.0603 months.
We also see that the Average Events is 374, which indicates that our target number of events were reached in every simulation ran, and we see that the average time required until these events were reached was 43.7541 months. Also we can see that the average number of dropouts that occurred was 6.1917.
In addition, since this is an unblinded trial we can see the per-group summary where the average number of events in the control group was 201.2353 and the average number in the treatment group was 172.7647. Finally we can also see the average number of dropouts in the control group was found to be 1.9108 and that of the treatment group was 4.2809.
| Prediction Result |
|
The main results from our simulation are that we expect the length of time until the required number of events are reached to be 43.7541 months. We also expect a total sample size of 460 to be recruited and that this will take 27.0603 months to occur.
|